System monitoring is the primary responsibility of every System Administrator. I think every system admin must know few command line and few automatic system monitoring tools. In this article, I am providing 15 monitoring tools and i hope it will help you.
#1. Top ( A Linux Command )
#top
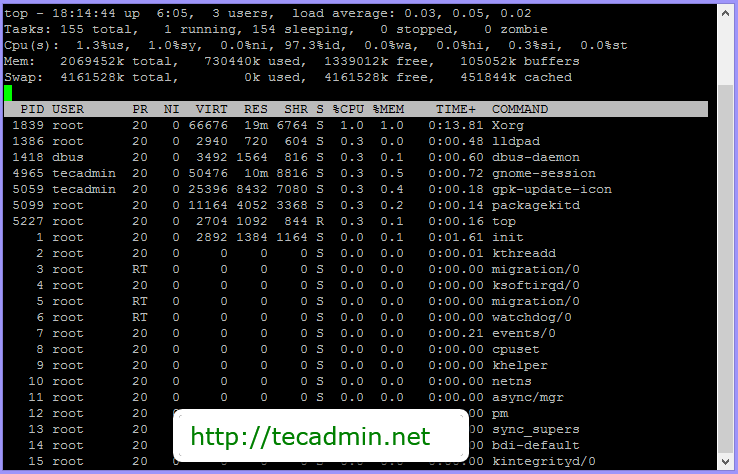
Read more – How to read Top command output
#2. ps
#ps -e PID TTY TIME CMD 1 ? 00:00:01 init 2 ? 00:00:00 kthreadd 3 ? 00:00:00 migration/0 4 ? 00:00:00 ksoftirqd/0 5 ? 00:00:00 migration/0 6 ? 00:00:00 watchdog/0 7 ? 00:00:00 events/0 8 ? 00:00:00 cpuset 9 ? 00:00:00 khelper 10 ? 00:00:00 netns 11 ? 00:00:00 async/mgr 12 ? 00:00:00 pm 13 ? 00:00:00 sync_supers ...
To List all Processes on Server
# ps aux
To List all Processes of Specific User
# ps -u <user_name>
#3. netstat (network statistics)
For example following command will provide list of all listening TCP and UDP ports with there services name.
#netstat -tulnp Active Internet connections (only servers) Proto Recv-Q Send-Q Local Address Foreign Address State PID/Program name tcp 0 0 0.0.0.0:111 0.0.0.0:* LISTEN 1371/rpcbind tcp 0 0 0.0.0.0:39698 0.0.0.0:* LISTEN 1458/rpc.statd tcp 0 0 0.0.0.0:22 0.0.0.0:* LISTEN 1683/sshd tcp 0 0 127.0.0.1:631 0.0.0.0:* LISTEN 1556/cupsd tcp 0 0 127.0.0.1:25 0.0.0.0:* LISTEN 1771/master tcp 0 0 :::80 :::* LISTEN 2247/httpd tcp 0 0 :::22 :::* LISTEN 1683/sshd udp 0 0 0.0.0.0:47307 0.0.0.0:* 1440/avahi-daemon udp 0 0 0.0.0.0:111 0.0.0.0:* 1371/rpcbind udp 0 0 0.0.0.0:631 0.0.0.0:* 1556/cupsd udp 0 0 0.0.0.0:41242 0.0.0.0:* 1458/rpc.statd udp 0 0 0.0.0.0:698 0.0.0.0:* 1371/rpcbind udp 0 0 :::111 :::* 1371/rpcbind
#4. Nagios
Using Nagios we can easily monitor host systems, local or remote services, network peripherals etc. It also provides a high level notification system via email, sms etc.
Read the Tutorial: Install Nagios and NagiosQL on CentOS, RHEL System
#5 vnStat
- Show Statistics for a day
#vnstat -d eth0 / daily day rx | tx | total | avg. rate ------------------------+-------------+-------------+--------------- 05/07/13 213.12 MiB | 837.71 MiB | 1.03 GiB | 120.06 kbit/s ------------------------+-------------+-------------+--------------- estimated 256 MiB | 0.98 GiB | 1.23 GiB |
- Show Statistics for a Month
# vnstat -m
- Show Statistics for a Hour
# vnstat -h
- Show Statistics in Real Time
# vnstat -l
Read More: Install vnStat and vnStat PHP on CentOS, RHEL Linux
#6 vmstat
#vmstat procs -----------memory---------- ---swap-- -----io---- --system-- -----cpu----- r b swpd free buff cache si so bi bo in cs us sy id wa st 0 0 0 1392620 108972 436948 0 0 15 4 17 20 0 0 99 0 0
You can also specify to show vmstat output on regular interval. Following example will show output on each 5 seconds.
#vmstat 1 procs -----------memory---------- ---swap-- -----io---- --system-- -----cpu----- r b swpd free buff cache si so bi bo in cs us sy id wa st 0 0 0 1392612 108980 436948 0 0 15 4 17 20 0 0 99 0 0 0 0 0 1392604 108988 436944 0 0 0 12 22 24 0 0 100 0 0 0 0 0 1392604 108988 436948 0 0 0 0 12 15 0 0 100 0 0 0 0 0 1392604 108988 436948 0 0 0 0 18 24 0 0 100 0 0
<
h4 class=”heading1″>#7 Munin
<
h4>
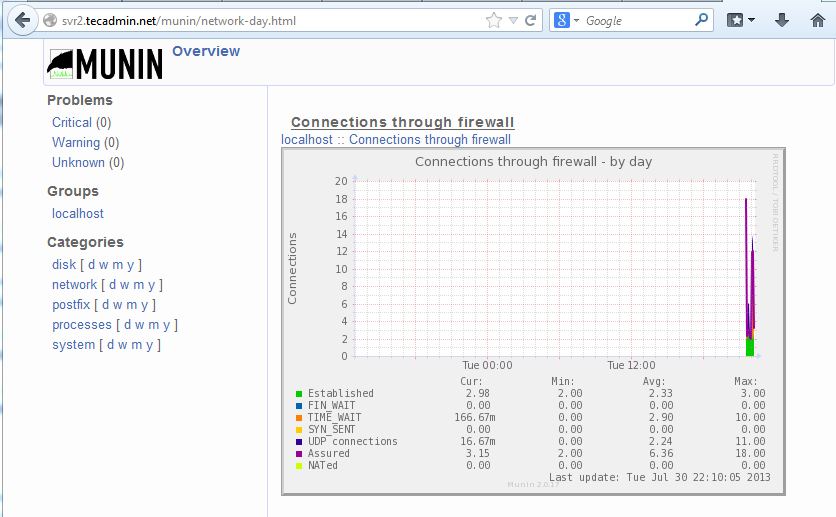
Read More: Installing Munin Network Monitoring in CentOS RHEL and Fedora
#8. Iostat
The
Check below output of simple iostat command, Its showing cpu details and attached disk statistics.
#iostat Linux 2.6.32-220.el6.i686 (tecadmin.net) 10/07/2013 _i686_ (1 CPU) avg-cpu: %user %nice %system %iowait %steal %idle 0.07 0.00 0.29 0.17 0.00 99.47 Device: tps Blk_read/s Blk_wrtn/s Blk_read Blk_wrtn scd0 0.00 0.01 0.00 392 0 sda 0.79 28.94 8.12 1178216 330444 dm-0 1.97 28.71 8.12 1168554 330376 dm-1 0.01 0.06 0.00 2576 0
Check statics of specific disk in system.
#iostat -d /dev/sda -m Linux 2.6.32-220.el6.i686 (tecadmin.net) 10/07/2013 _i686_ (1 CPU) Device: tps MB_read/s MB_wrtn/s MB_read MB_wrtn sda 0.78 0.01 0.00 575 161
#9. Cacti
Cacti also provides a “data input” mechanism which allows users to define custom scripts that can be used to gather data.
Read More: Install Cacti ( Network Graphing Tool ) on CentOS and RHEL System
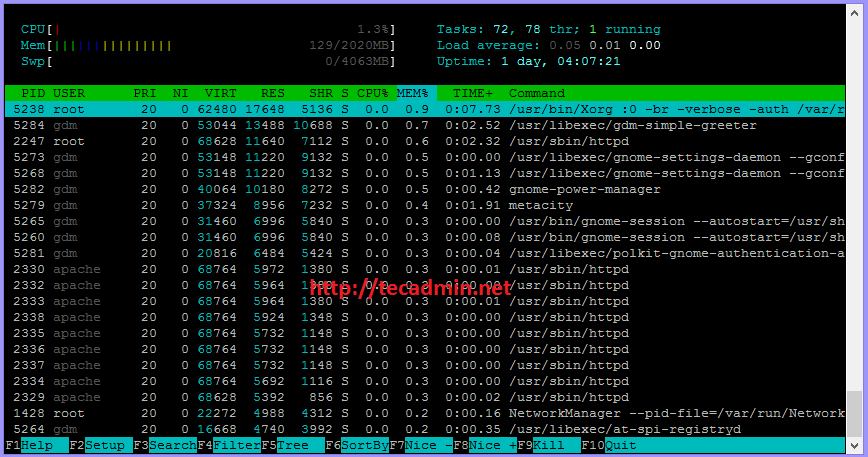
#10. Htop
htop also provides a better way to navigate to any process using keyboard Up/Down keys as well as we can also operate it using mouse. To use simply type htop command on terminal
#htop
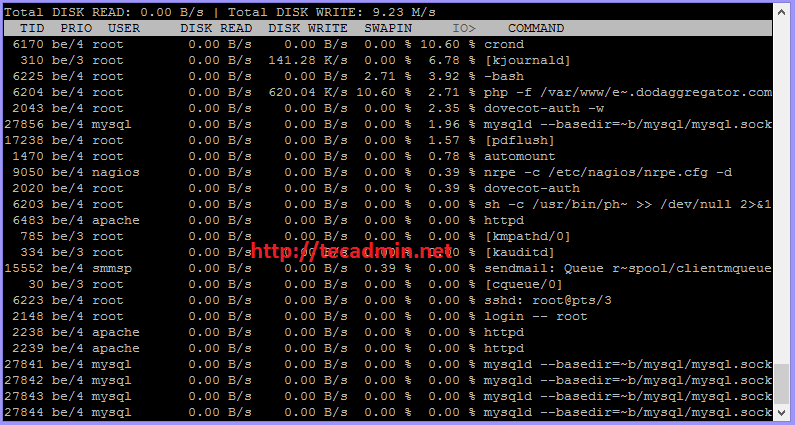
#11. iotop
#iotop
<
h4 class=”heading1″>#12. uptime
#uptime 21:15:44 up 1 day, 6:56, 4 users, load average: 0.17, 0.43, 0.48
Additionally it shows how many users are currently logged on, and the system load averages for the past 1, 5, and 15 minutes.
#13. Strace
For example we use ‘ls’ command to list files and directories but we can not edit source code of this command. In case this command not worked properly we have no option to modify its code but we can trace the but we can system calls and signals generated by this command.
#strace ls execve("/bin/ls", ["ls"], [/* 26 vars */]) = 0 brk(0) = 0x9558000 mmap2(NULL, 4096, PROT_READ|PROT_WRITE, MAP_PRIVATE|MAP_ANONYMOUS, -1, 0) = 0xb7871000 access("/etc/ld.so.preload", R_OK) = -1 ENOENT (No such file or directory) open("/etc/ld.so.cache", O_RDONLY) = 3 fstat64(3, {st_mode=S_IFREG|0644, st_size=57422, ...}) = 0 mmap2(NULL, 57422, PROT_READ, MAP_PRIVATE, 3, 0) = 0xb7862000 close(3) = 0 ... ...
To view only read system calls use -e option
#strace -e read ls read(3, "177ELF111 3 3 1 220303A 004 "..., 512) = 512 read(3, "177ELF111 3 3 1 2003300 004 "..., 512) = 512 read(3, "177ELF111 3 3 1 340lp 004 "..., 512) = 512 read(3, "177ELF111 3 3 1 p366320 064 "..., 512) = 512 read(3, "177ELF1113 3 3 1 @23623 004 "..., 512) = 512 read(3, "177ELF111 3 3 1 `312+ 004 "..., 512) = 512 read(3, "177ELF111 3 3 1 260|, 004 "..., 512) = 512 read(3, "177ELF111 3 3 1 Pn337 004 "..., 512) = 512 read(3, "nodevtsysfsnnodevtrootfsnnodevtb"..., 1024) = 368 read(3, "", 1024)
<
h4 class=”heading1″>#14. sar
Default sar command shows activity of CPU like below.
#sar Linux 2.6.32-220.el6.i686 (tecadmin.net) 10/08/2013 _i686_ (1 CPU) 12:00:01 AM CPU %user %nice %system %iowait %steal %idle 12:10:01 AM all 0.01 0.00 0.09 0.01 0.00 99.89 12:20:01 AM all 0.02 0.00 0.08 0.02 0.00 99.88 Average: all 0.01 0.00 0.09 0.01 0.00 99.89
To view activity of Ethernet cards use following command.
#sar -n DEV Linux 2.6.32-220.el6.i686 (tecadmin.net) 10/08/2013 _i686_ (1 CPU) 12:00:01 AM IFACE rxpck/s txpck/s rxkB/s txkB/s rxcmp/s txcmp/s rxmcst/s 12:10:01 AM lo 0.00 0.00 0.00 0.00 0.00 0.00 0.00 12:10:01 AM eth0 1.76 0.00 0.18 0.00 0.00 0.00 0.00 12:20:01 AM lo 0.00 0.00 0.00 0.00 0.00 0.00 0.00 12:20:01 AM eth0 1.83 0.02 0.19 0.00 0.00 0.00 0.00 Average: lo 0.00 0.00 0.00 0.00 0.00 0.00 0.00 Average: eth0 1.79 0.01 0.19 0.00 0.00 0.00 0.00
#15. zabbix
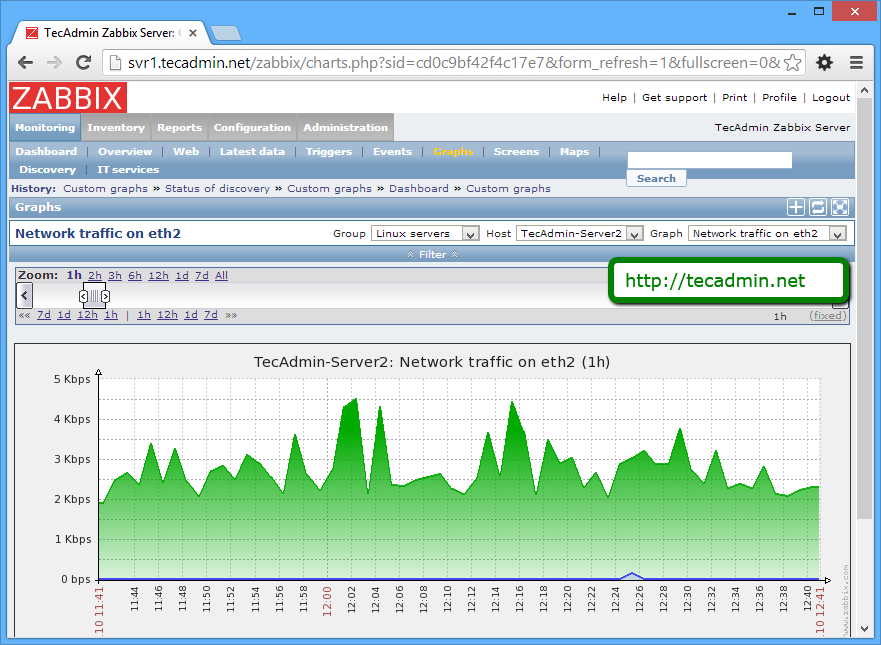
Zabbix provides many other important features useful for monitoring. Read more about zabbix feature.
Read More Install Zabbix Network Monitoring on CentOS/RHEL and Fedora
 Ports in Linux")
")

2 Comments
Nice list. One more suggestion you might want to consider for monitoring tool is AgentlessMonitor from AppPerfect which covers most of the aspects of monitoring like JAVA / J2EE application monitoring, server monitoring, database monitoring, transaction monitoring, network monitoring, log monitoring and system monitoring and last, but not the least is available for free. It is very easy to use and more details can be found at http://www.appperfect.com/products/agentless-monitor.php
Thanks!